The State of the Academic Workforce in Physics and Astronomy Departments, 2000-2022


About the Academic Workforce Survey
Every two years, the American Institute of Physics surveys all degree-granting physics or astronomy departments across the United States to conduct a national census on the number of currently employed faculty members. This survey includes departments that only award a PhD, master’s, or bachelor’s degree in physics, only award a degree in astronomy, or award degrees in both physics and astronomy. Surveys are completed by department chairs or administrators. The survey typically receives responses from around 90% of all degree-granting physics and astronomy departments. The remaining percentage is calculated using faculty member counts from public department web pages and calculated weighted estimates for faculty member numbers.
Figure 1 and Table 1 below show the locations of physics and astronomy departments and the number of responses received in the most recent round of the Academic Workforce Survey in Spring of 2022. Most physics departments award a bachelor’s degree as their highest degree, while most astronomy departments award a PhD.
Figure 1

Table 1
![Graph 2 Number of responding departments [Recovered]-01.png](https://aip.brightspotcdn.com/dims4/default/9510f7a/2147483647/strip/true/crop/3466x2346+0+0/resize/820x555!/quality/90/?url=https%3A%2F%2Fk1-prod-aip.s3.us-east-2.amazonaws.com%2Fbrightspot%2Fc9%2F3c%2Fee96c1d444a8856a223530a712fe%2Fgraph-2-number-of-responding-departments-recovered-01.png)
Total Number of Full-Time Equivalent Faculty Members in Physics and Astronomy Departments
Table 2 and Table 3 below show the total number of faculty members employed in physics and astronomy departments over time. Data collection for faculty members in physics departments began in 2000, and data collection for faculty members in astronomy departments began later in 2014. A faculty member includes any position in the department that involves teaching or research in physics or astronomy in the 2021–22 academic year. These counts do not include graduate students or postdocs. Total faculty members are counted by full-time equivalent status, meaning a full-time faculty member is counted as 1, while a part-time faculty member is counted as something less than 1 (for example, 0.5) depending on the amount of work they perform in a department.
For physics departments, results are shown by department type, whether a department awards a PhD, master’s, or bachelor’s as their highest degree. There are too few astronomy departments that award only master’s or bachelor’s degrees to show results by department type; therefore, results for all departments are shown for astronomy.
Table 2

Table 3

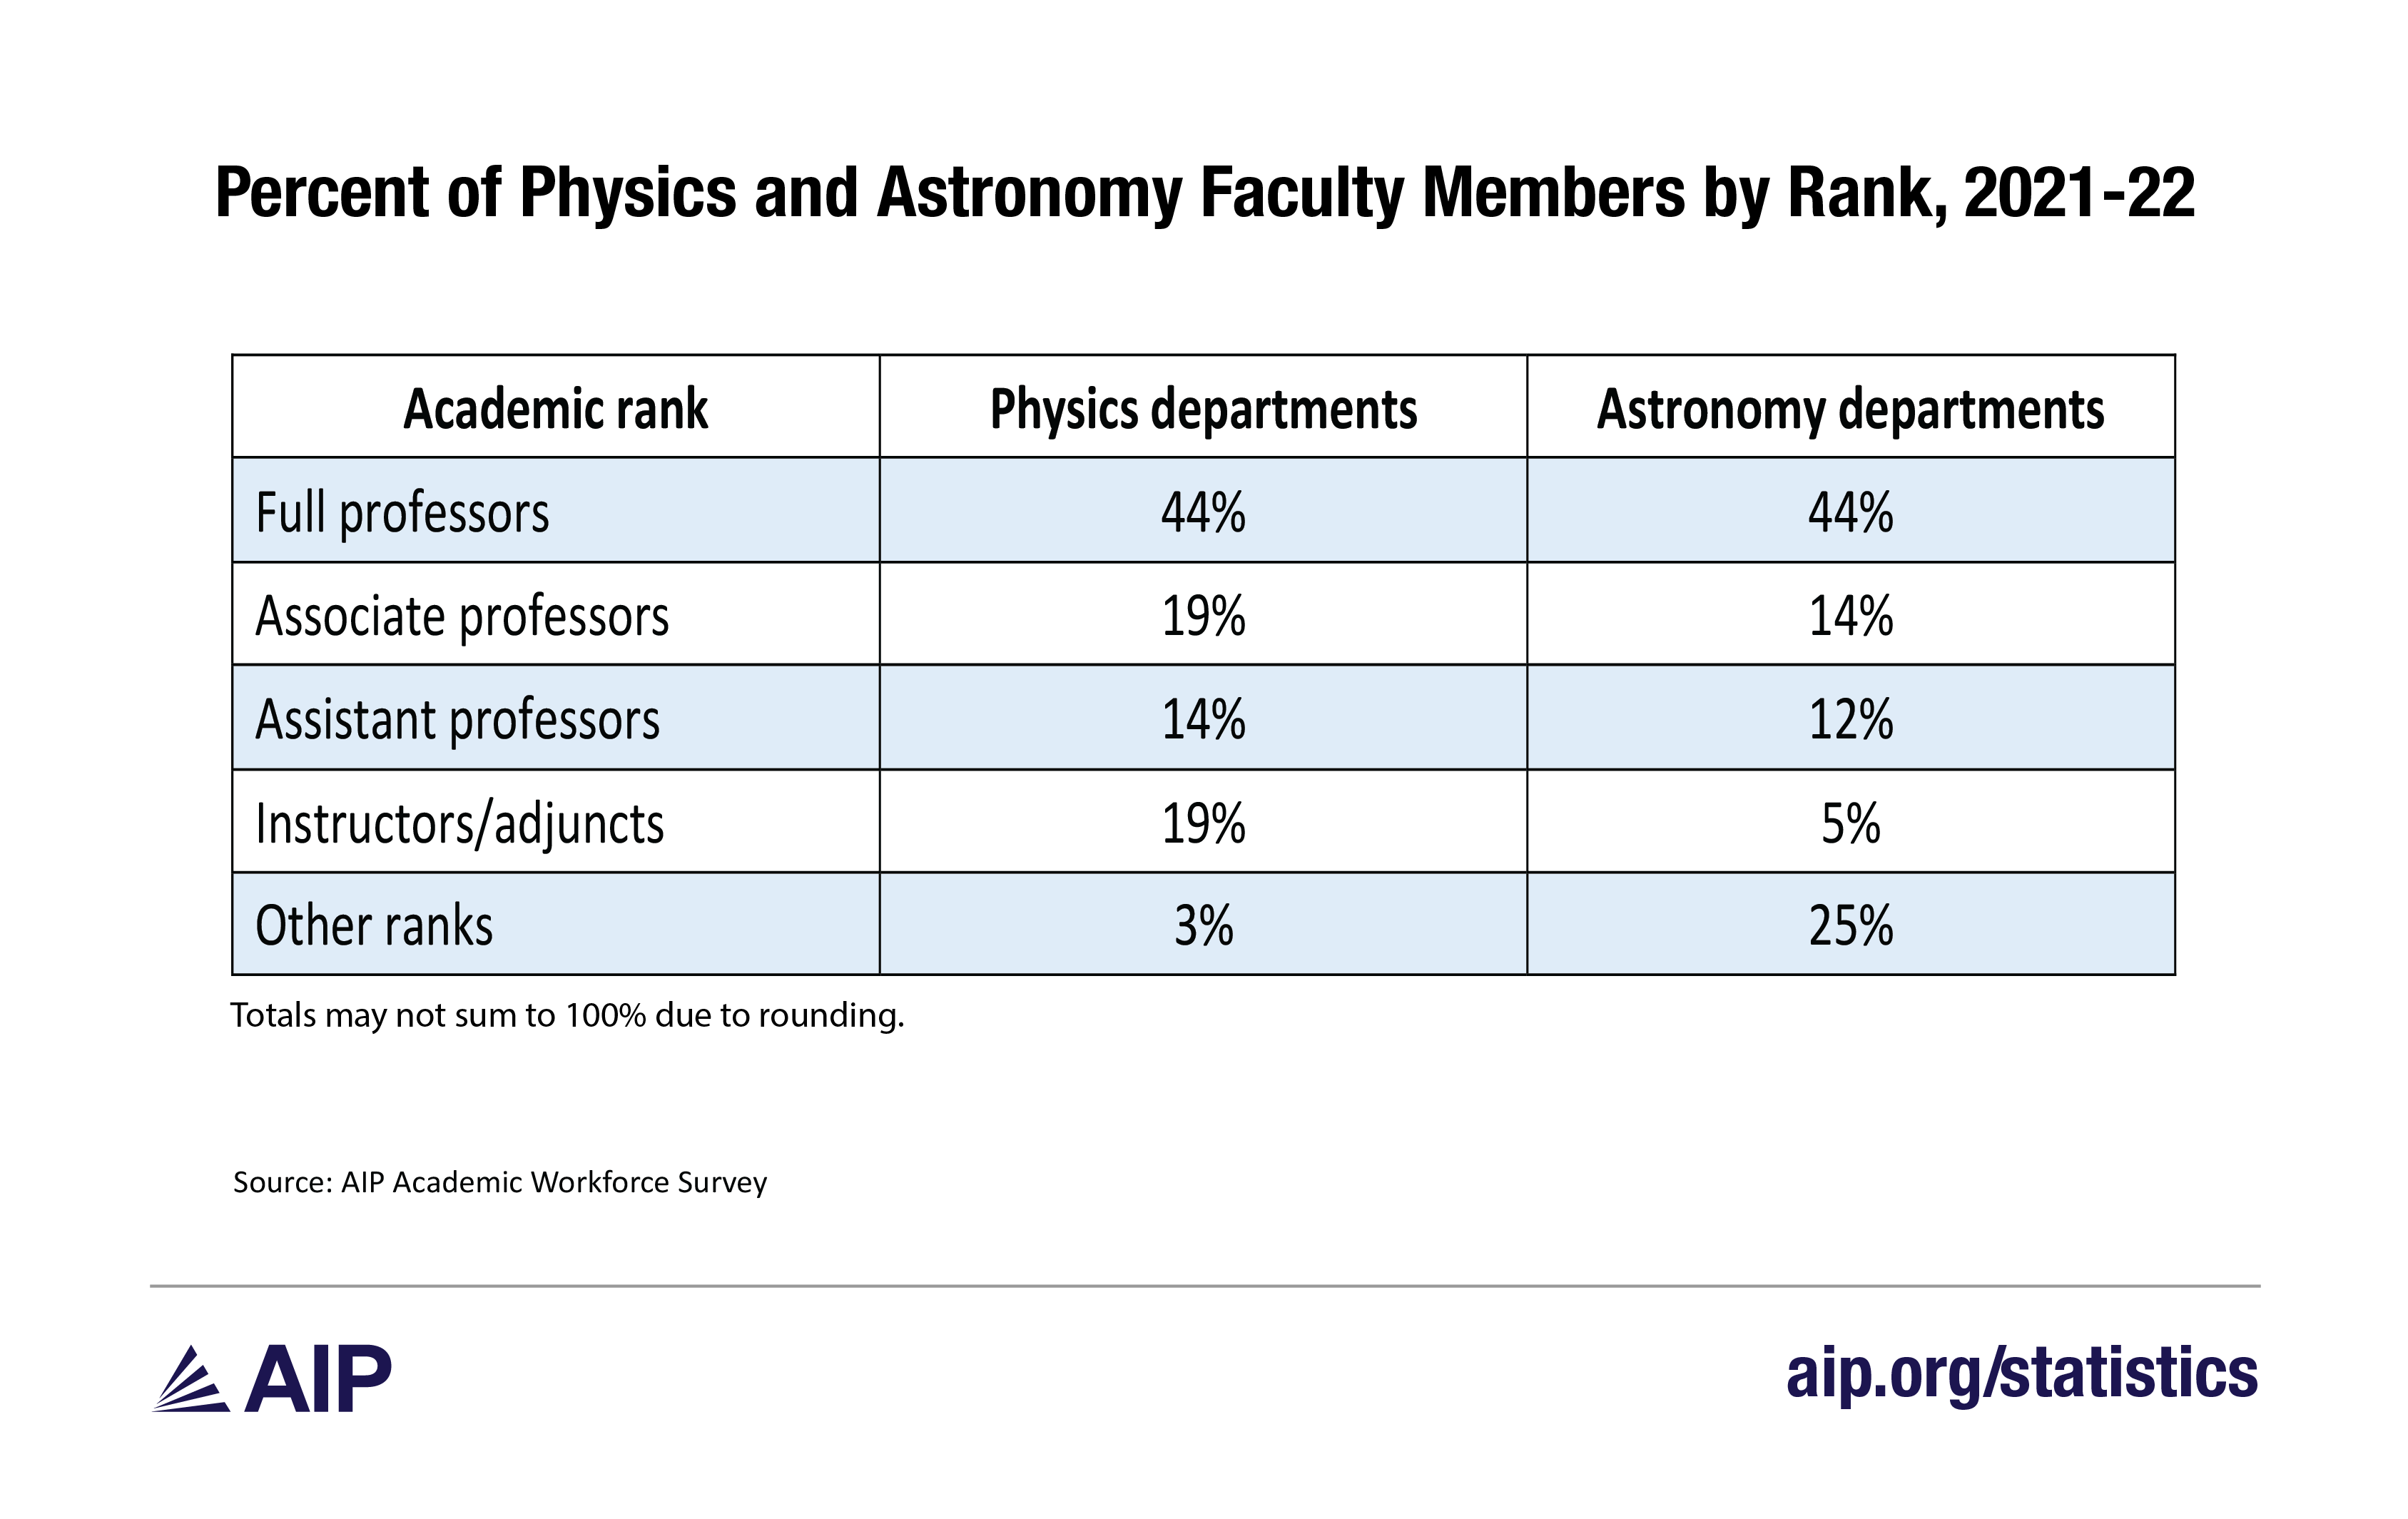
Tenure Status and Rank of Full-Time Equivalent Faculty Members in Physics and Astronomy Departments
Table 4 and Table 5 below show the tenure status and rank of faculty members in physics and astronomy departments from the most recent round of the survey in 2021–22. Most faculty members are tenured and full professors in departments.
Table 4

Table 5

Figure 2 and Figure 3 below show how the tenure status has changed over time, particularly for non-tenured positions. There are too few astronomy departments that award only master’s or bachelor’s degrees to show results by department type. Overall, the percentage of non-tenured positions has remained stable since 2014, although we do see a notable increase in non-tenured positions for physics departments that award a master’s as their highest degree.
Figure 2

Figure 3

Figure 4 and Figure 5 further show the tenure and rank of faculty members by physics department type in the most recent survey in 2021–22, whether they award a PhD, master’s, or bachelor’s as their highest degree. PhD-granting departments employ a greater percentage of tenured positions and full professors. Other ranks can include positions such as visiting professors.
Figure 4

Figure 5
Figure 6 and Figure 7 show tenure status and rank of new faculty members, hired during the most recent round of the survey in 2021–22. Most new hires are tenure-track positions and are assistant professors, instructors, or adjuncts. Departments that award a physics bachelor’s as their highest degree hire a greater percentage of non-tenured positions. Other ranks can include positions such as visiting professors.
Figure 6

Figure 7

Women Employed at Physics and Astronomy Departments
Table 6 and Figure 8 below show the percentage of women employed in physics departments over time by rank. These counts are in headcounts, not by full-time equivalent status. The percentage of women faculty in physics departments has steadily increased over time.
Table 6

Figure 8

Table 7 and Figure 9 below show the percentage of women employed in astronomy departments over time by rank. Since 2003, the percentage of women faculty employed in astronomy departments has steadily increased.
Table 7

Figure 9


![Graph 2 Number of responding departments [Recovered]-01.png](https://aip.brightspotcdn.com/c9/3c/ee96c1d444a8856a223530a712fe/graph-2-number-of-responding-departments-recovered-01.png)


