Has the number of students taking physics in US high schools declined?


In 1987, we conducted our first survey of High School Physics in response to questions from the community about the qualifications of teachers teaching high school physics and about enrollments in high school physics. Since the first study, we have conducted this study regularly (every three to six years). For the first time, we believe we are seeing a decline in the number of students taking a physics course in US high schools. While the decline is small, it cannot be traced to a decline in the total number of students enrolled in high school. Table 1 summarizes the changes we have seen in high school data since our last survey in 2018-19.

Table 1
We must stress that these results are preliminary, but we believe we will see a decline when the data are finalized. We need another three or four months to ensure the total presented here is consistent with the sum of the number of students enrolled in various types of physics classes. We expect little change in this total number.
This decline exists amid an increase in students in 12th grade and an increase in the number of schools. It must be noted that the number of teachers teaching at least one physics course increased modestly; this suggests that fewer teachers are teaching all or primarily physics.
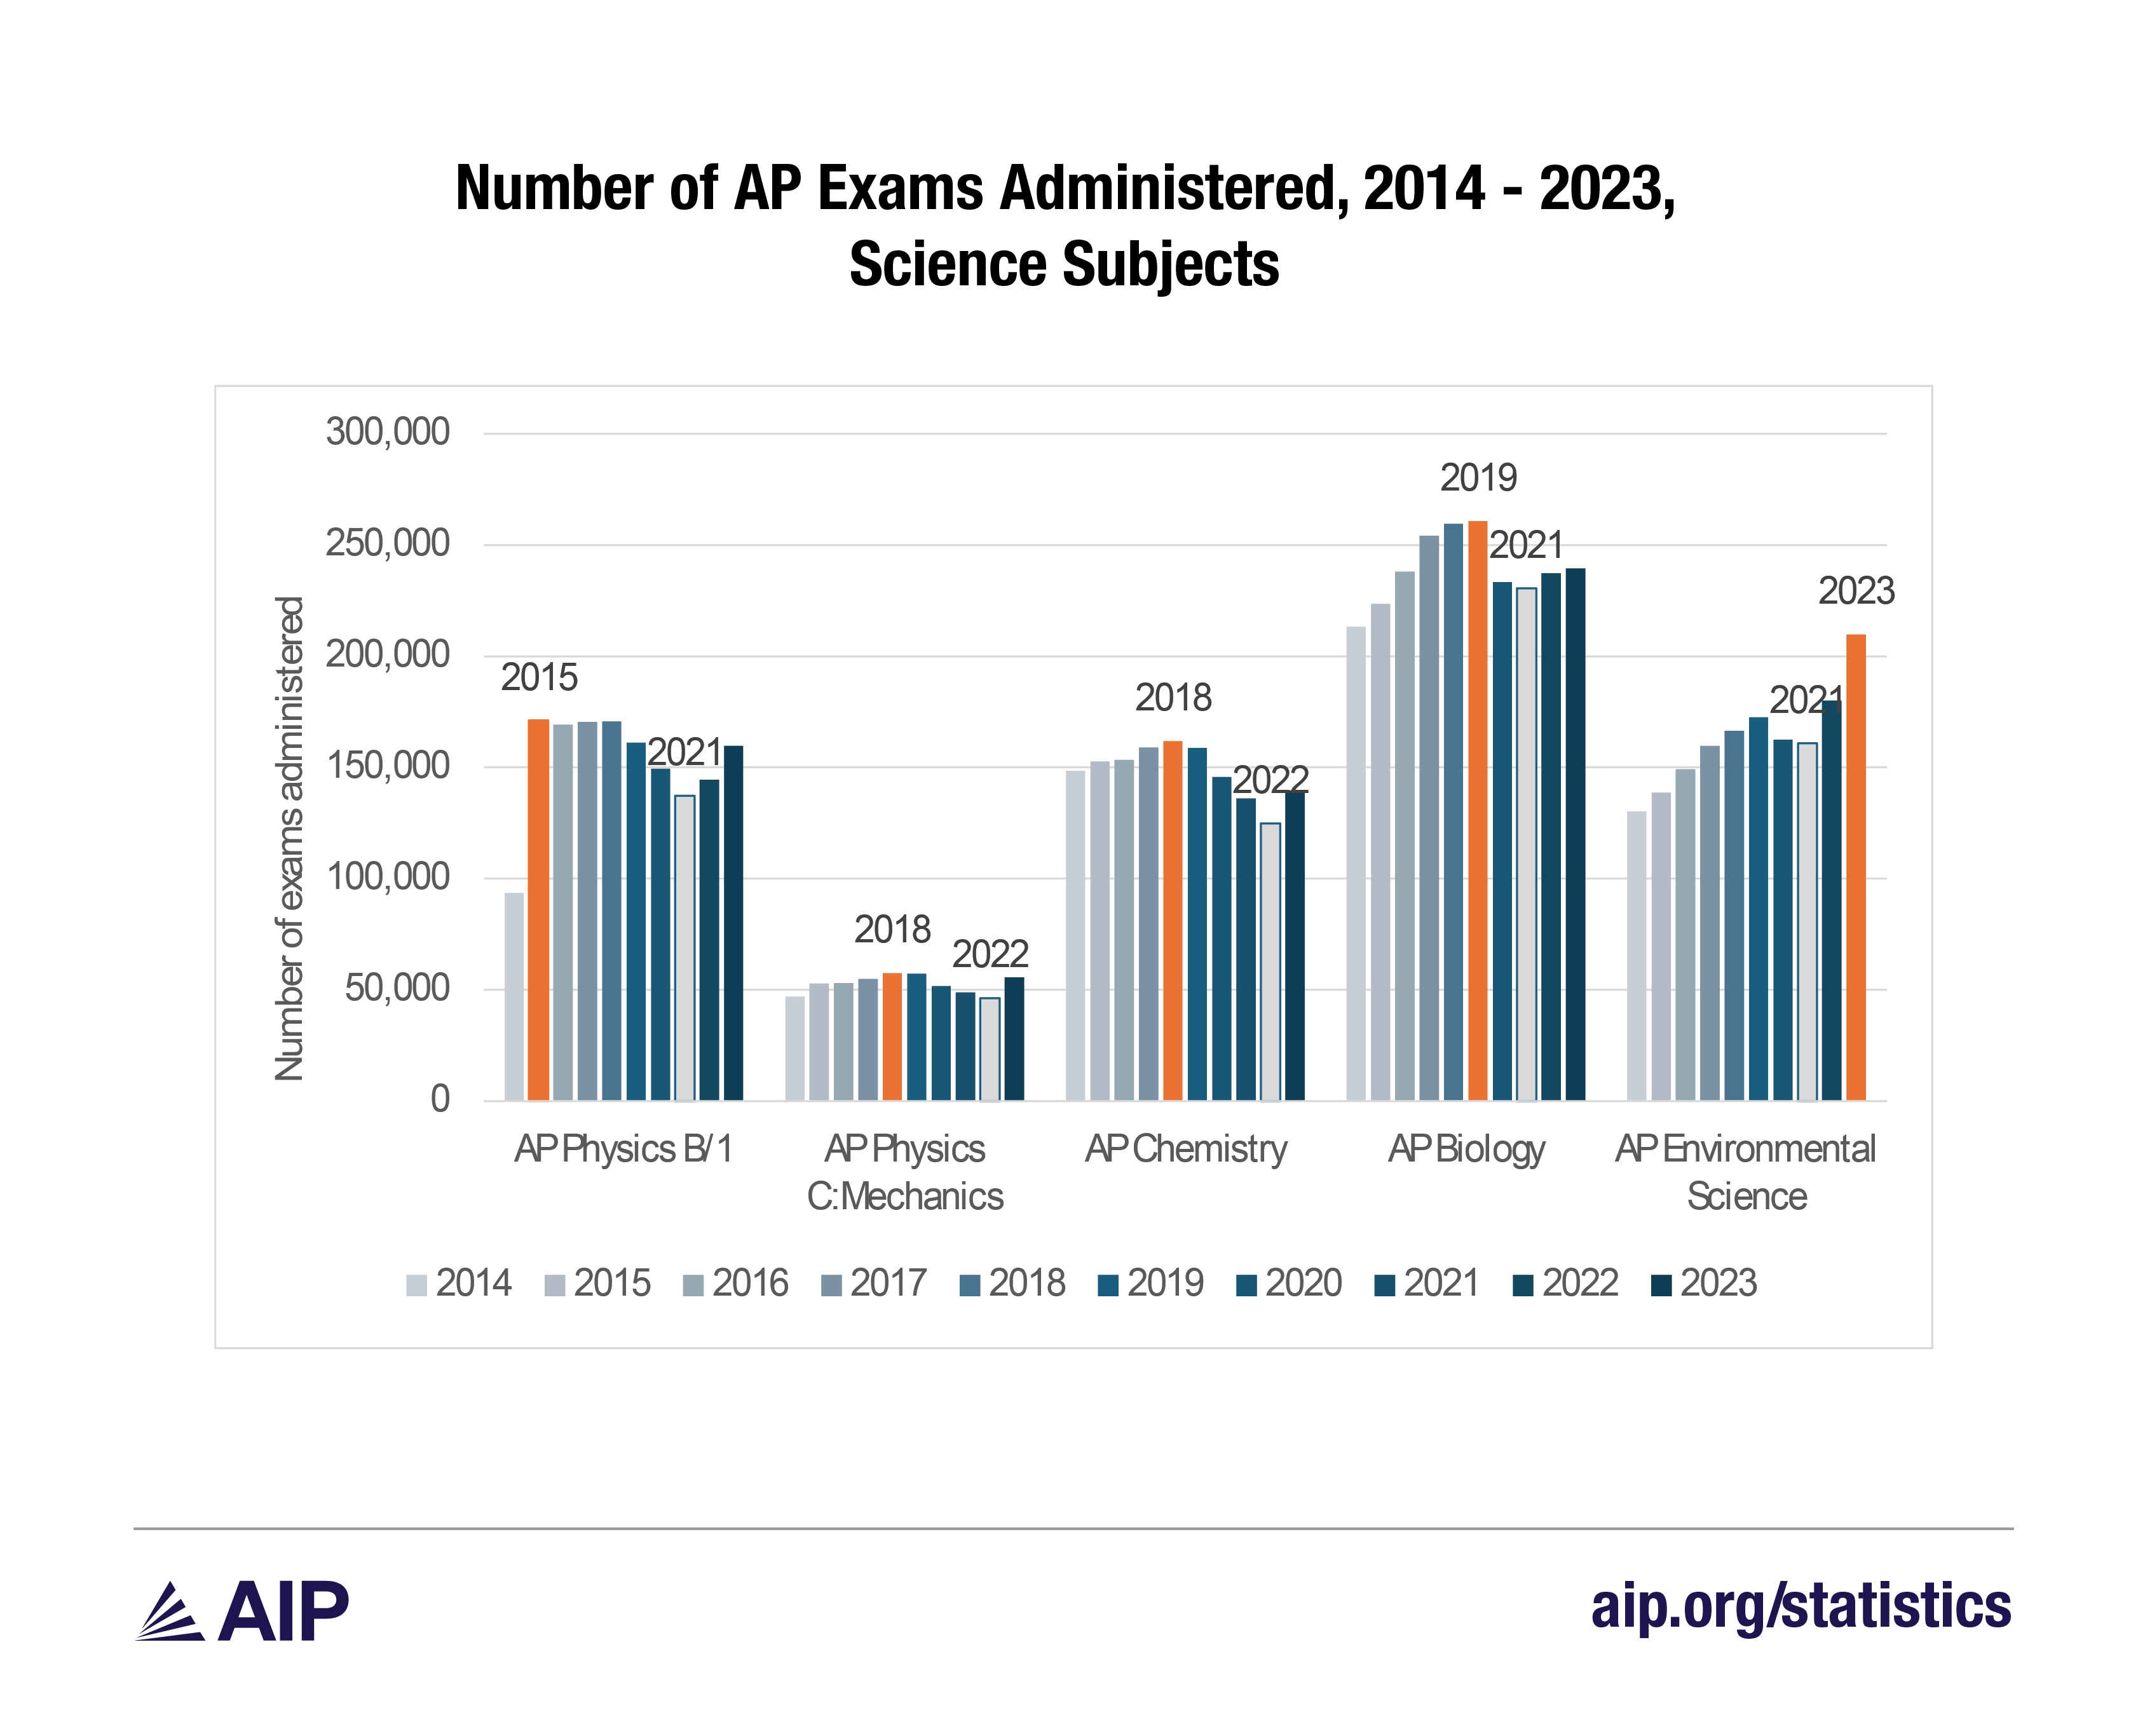
To understand what might be happening, we looked at AP exam taking in science subjects over the last decade. These results are available from the AP Exam Administration Data Archive . See Figure 1 below.

Figure 1
The sharp increase in AP Physics B/1 exams administered in 2014 and 2015 resulted from the change to AP Physics 1 & 2 from AP Physics B. We show only AP Physics 1 because AP Physics 2 is the second course in a two-course sequence. After the jump in 2015, the number of AP Physics 1 exams is relatively stable, with a drop during the early 2020s. The same applies to AP Physics C, AP Chemistry, and AP Biology exams. The number of AP Environmental Science exams administered is the only science subject that shows a maximum after 2021 or 2022. One might wonder if these variations are consistent with the total number of AP exams administered. Figure 2 shows that the total number of AP exams administered increased through 2019, then fell for two years, reaching its lowest point for the last decade in 2021. It has rebounded, and 2023, with 2,869,418 exams administered, was an all-time high.

Figure 2
In Figure 3, we provide a different look at Figure 1; this time we have marked the peak year with an orange bar and the lowest with a gray bar. Only AP Environmental Science shows a pattern that mirrors the overall number of exams given.

Figure 3
It is possible that the decline in enrollments in high school physics is mirrored in biology and chemistry enrollments. As more class options are available to students, students may choose to focus on specific topics, opting, for example, to take astronomy or space science in lieu of physics. Other highlights may emerge as we delve deeper into our most recent data. We will keep you informed.
We offer the following view as a final demonstration of the shifts in AP exam-taking in science. In Figure 4, we demonstrate the number of exams administered in a particular subject as a proportion of the number of AP Biology exams administered. More than 200,000 students have taken the AP Biology exam every year over the last decade. The figure reveals the steady growth in the number of AP Environmental Science administered.

Figure 4
In summary, the number of students enrolled in high school physics courses exhibited a first-ever decline in our most recent survey. This decline is not a function of lower high school enrollment overall; the number of students in grade 12 increased. Are we seeing a shift in science-taking patterns overall? We will continue to monitor these trends.
Methodology
This study is based on a sample of one-sixth of the public and private high schools classified as regular, technical, or emphasis schools by the US Department of Education. In the fall of 2023, we began with web searches for each of the ~3,990 high schools in our sample. If we could identify a physics teacher at the school, we collected the contact information for that teacher. If not, we collected contact information for the principal or science chair. Then, using phone and email, we contacted each school where we had not identified a physics teacher to determine whether physics was offered at the school and, if so, who taught it. While we gathered contact information (either a physics teacher, a principal, or a science chair) for almost all of the schools in our sample (99%), we neither identified a physics teacher nor heard back from the principal or science chair for 38% of the schools in our sample. Thus, we know whether physics was offered and who taught it in 62% of the schools in our sample.
During the spring of 2024, we contacted each of the ~3,100 teachers we had identified in the fall to learn more about physics in each school where it was offered. The teacher survey was conducted by web only; we invited teachers to participate using email. We received responses from 27% of the teachers we contacted.
Note: we use the term “high school” here to refer to any school with at least 3 students enrolled in grade 12. Some of these “high schools” include more grades than 9 - 12; they all include a grade 12.


